Although Generative Adversarial Networks (GANs) are breaking the ground in daily basis, there is no gold-standard metric to measure how well the genertor works. We all know that several ML tasks’ standard metrics - such as mean square error (MSE) for linear regression and cross entropy for classification - but what about for GANs? How do we choose the best model upon our model selection?
Why is evaluating GANs hard?
Let’s break down the necessities first. We need to take care of two main characterstics for the generated images: fidelity and diversity.
- Fidelity
- Quality of images - how realistic are the generated images; discriminability.
- Diversity
- Variaty of images. GANs should not generate single image any time.
Not only for those two, it has been suggested to measure disentanglement of the latent space, boundness, agreement with human perceptual judgements, etc.1 After all those traits to fulfill, there has yet to appear a concurred metric for evaluating GANs.
Qualitative Measurements
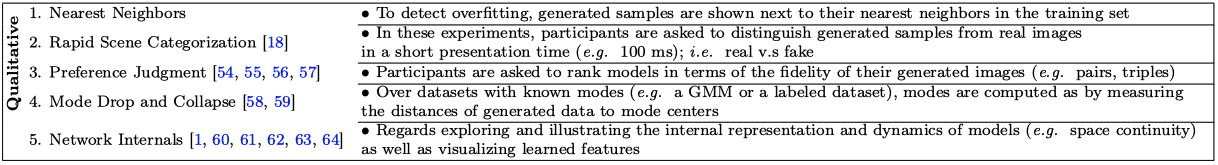
Qualitative measures, from Ali(2019).1
It is definitely possible to hire persons to manually evaluate each model, but is not a valid option in ordinary cases due to the cost and consistency issues.
According to the survey paper, there are some of qualitative approaches to measure performance of GANs:
- Nearest Neighbors
- Rapid Scene Categorization
- Rating and Preference Judgment
- Evaluating Mode Drop and Mode Collapse
- Investigating and Visualizing the Internals of Networks.
All above requires human participants, but if those are done by M-Turk or equivalent cost-efficient services, they can be some promising measures to detect apparent features. We’ll skip the thorough examination of each metric in this post. Instead, let’s focus on some quantitative metrics which are widely used.
Quantitative Measurements
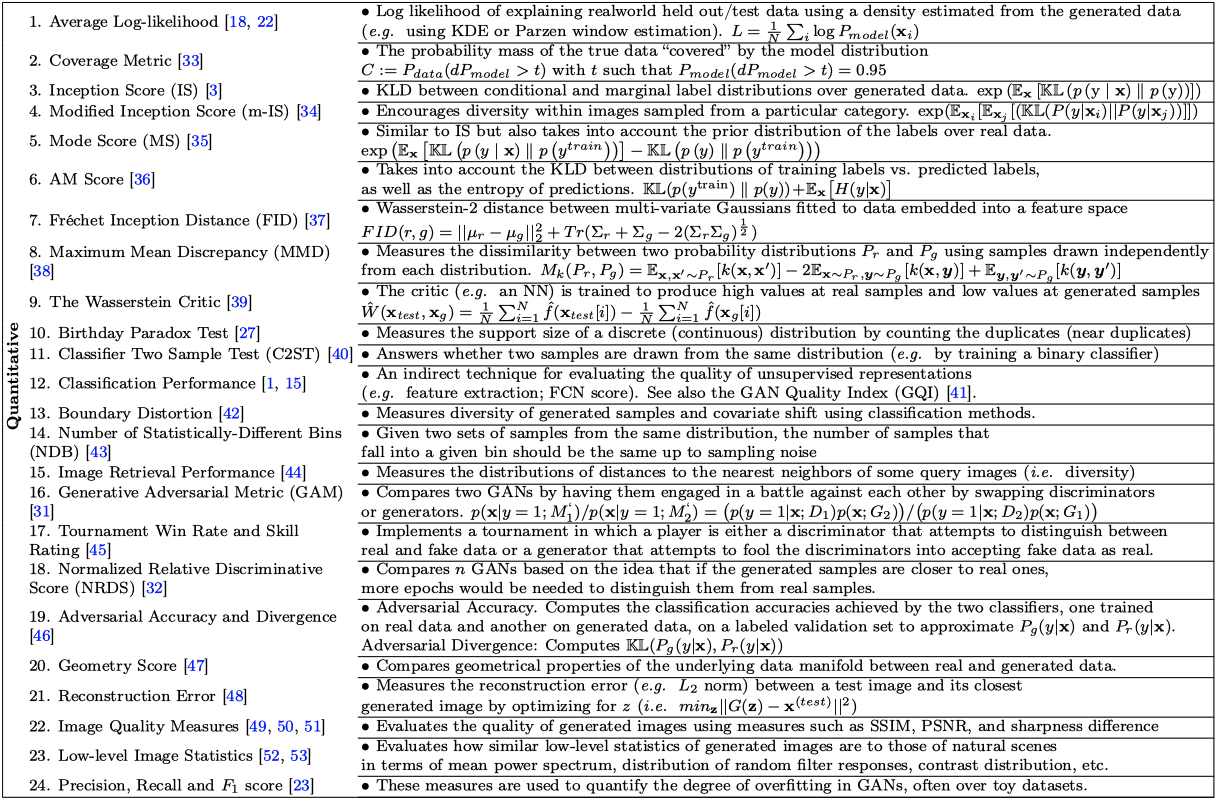
Quantitative measures, from Ali(2019).1
There are tons of metrics suggested above, but we’ll focus on Inception Score (IS), Fréchet Incption Distance (FID) and Maximum Mean Discrepancy (MMD) from the table.
Inception Score (IS)
IS is based on the pre-trained ImageNet model, Inception-v3. This metric measures the Kullback-Leibler divergence between the conditional and marginal label distributions over generated data. Defined as:
\[IS(\mathcal{G}) = \exp [ \mathbb{E}_{x \sim \mathbb{P}_\mathcal{G}} D_{KL}(p_\mathcal{M}(y|x) \| p_\mathcal{M}(y)) ]\]where $\mathcal{G}$ stands for generator model in interest, pre-trained inception model $\mathcal{M}$. Though IS is widely adopted through many literatures, shortcomings of IS emerged. First, the metric depends on the distributions, both based on $\mathcal{M}$, and second, the distribution of the real data ($\mathbb{P}_{r}$) is not used anywhere.2 Hence, IS is prone to
- be exploited or gamed. This means the model can overfit to ‘easier’ classes, not covering the whole labels.
- miss useful ‘real’ features, as the metric only relies on $\mathcal{M}$.
Fréchet Inception Distance (FID)
FID is suggested to overcome IS’s shortcomings. This idea is originated from the signal difference metric. According to DeepLearning.ai’s explanation, we can understand the original Fréchet distance as minimum leash distance between a human and a dog strolling.
FID uses not only pre-trained Inception-v3’s feature maps, but also bases on the objective dataset’s distribution. Defined as:
\[FID(r, \mathcal{G}) = \| \mu_r - \mu_\mathcal{G} \|^2_2 + tr ( \Sigma_r + \Sigma_\mathcal{G} - 2 \sqrt{\Sigma_r \Sigma_\mathcal{G}} )\]where $\mu_\cdot$ is the mean and $\Sigma_\cdot$ is the covariance matrix. The lower the FID, the better model $\mathcal{G}$ is. Hence, FID is likely to measure the FD between two multivariate normal distributions. FID still has limitations such as:
- cannot capture all the real features as it puts its feet on Inception.
- needs a large sample size to reduce noise during the calculation.
- only limited statistics used. Normal distribution assumption could lose information.
Based on my experience, pytorch-FID took ~2 min for 3K and 5K image pools one Nvidia Titan RTX.
Maximum Mean Discrepancy (MMD)
Above two metric are widely used in practice, but we can also take a look at a non-Inception-based metric. MMD measures the dissimiliarity between the real distribution and generated distribution for some fixed kernel function $k$.
\[MMD_k (r, \mathcal{G}) = \mathbb{E}_{x, x' \sim \mathbb{P}_r} [k(x, x')] - 2\mathbb{E}_{x \sim \mathbb{P}_r,\ y \sim \mathbb{P}_\mathcal{G}} [k(x, y)] + \mathbb{E}_{y, y' \sim \mathbb{P}_\mathcal{G}} [k(y, y')]\]Empirically, MMD works well with the kernels on feature space of pre-trained ResNet. The computing complexity is also low, so some studies suggest to use this metric.2
Bonus: Perceptual Path Length (PPL)
For the last metric, we can also take look at the off-topic-but-maybe-useful measurement. PPL is first introduced in StyleGAN3 for measuring “how a generator manages smoothly interpolate between points in its latent space”. The authors used VGG16 embeddings for comparison to concur with human perception. PPL on the latent space $\mathcal{Z}$ would be:
\[PPL_\mathcal{Z} = \mathbb{E} \left[ \frac{1}{\epsilon^2} d(\mathcal{G}(\text{slerp}(z_1, z_2; t)), \mathcal{G}(\text{slerp}(z_1, z_2; t+\epsilon))) \right]\]where $d$ is the perceptual distance between the images on VGG16, $\text{slerp}$ is the spherical linear interpolation, and $\epsilon=10^{-4}$ as an arbitrary small number. This looks sneezy but this means the empirical mean of the perceptual distances between consequently generated images.
This measure fits perfectly to the objective of StyleGAN - to learn the disentangled continuously controllable styles with the latent vectors.
Wrap up
Although FID and IS are widely used in the field, they are still not the gold-standard
for the GAN performance metric. Researchers are seeking alternatives, so we can
wait for the brains of the era find the result ![]()
Read more
- How to evaluate generative adversarial networks, J. Brownlee, 2019
- Evaluation, DeepLearning.ai on Coursera, 2020
-
Borji, Ali. “Pros and cons of gan evaluation measures.” Computer Vision and Image Understanding 179 (2019): 41-65 ↩ ↩2 ↩3
-
Xu, Qiantong, et al. “An empirical study on evaluation metrics of generative adversarial networks.” arXiv preprint arXiv:1806.07755 (2018). ↩ ↩2
-
Karras, Tero, Samuli Laine, and Timo Aila. “A style-based generator architecture for generative adversarial networks.” Proceedings of the IEEE conference on computer vision and pattern recognition. 2019. ↩